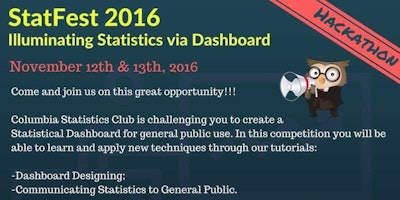
Hackathon -StatFest 2016 - Illuminating Statistics via Dashboard
StatFest 2016 - Illuminating Statistics via Dashboard
The theme of this Hackathon is to create dashboards for visualizing statistical concepts that is accessible to general public.
Through the series of lectures and the Hackathon contest afterwards, you will get familiar with the R shiny apps in Rstudio.
There will be two winning teams in the contest. Each team will be awarded with $** gift card. Food & drinks are provided during the StatFest.
When:12th Nov. 9am - 9pm
13th Nov. 9am - 5pm
Where: Lerner Hall Room555
IMPORTANT:
Due to the equality of registration, we didn't release all formal tickets at a time.
For people on the waitlist: We will release more tickets at a certain time and you will receive a confirmation email, to which you need to respond as soon as possible to claim your formal ticket.
Organizer: Columbia Statistics Club email: cscexecutive@gmail.com
The schedule and other specific information is coming soon, and we will send you in future emails.
You can also follow our Facebook page: @columbiastatisticsclub for any update about this event.
Detailed Schedule:
Saturday (11/12) morning
- 9:00-10:00 Registration and ice-breaking
- 10:00-10:30 "Accessible statistics for general public", Challenge release,
Dr. Neda Afsarmanesh, Stats.org
- 10:30-11:00 Q&A
- 11:00-12:00 Team forming
- 12:00-12:45 During lunch "Illustrating concepts using Shiny dashboard",
Professor Tian Zheng
Saturday (11/12) afternoon
- 13:00-14:00 teams working
- 14:00-14:45 "Effective visual communication for dashboard" Professor Joyce Robbins
- 14:45-15:00 Q&A
- 15:00-21:00 teams working
Sunday (11/13) morning
- 10:00-10:45 "Communicating statistics to general public: dos and don'ts",
Dr. Trevor Butterworth, Sense about Science USA
Sunday (11/13) afternoon
- 3:00-4:00 Presentations
- 4:00-4:30 Judging
- 4:30-5:00 Winners announced,with prizes awarded.
Location
Dates
to 13th November 2016 - 05:00 PM
